
| Thread overview | |||||||||
|---|---|---|---|---|---|---|---|---|---|
|
February 16, 2014 Setting up GDB debugger with Eclipse | ||||
|---|---|---|---|---|
| ||||
 | Hi, I'm new to this group and Eclipse. I have installed Eclipse with DDT and GDB and the debugger steps through a HelloWorld.cpp successfully, but a DDT project doesn't do likewise. The HelloWorld.d prints the correct output to the console but there doesn't seem to be any debug activity. Here are some screenshots of the Eclipse menus: http://tryimg.com/4/ejnj.png | |||
 Permalink
 Reply
Reply
February 17, 2014 Re: Setting up GDB debugger with Eclipse | ||||
|---|---|---|---|---|
| ||||
Posted in reply to Michael Sentinella | On Sunday, 16 February 2014 at 14:10:03 UTC, Michael Sentinella wrote: > Hi, I'm new to this group and Eclipse. I have installed Eclipse with DDT and GDB and the debugger steps through a HelloWorld.cpp successfully, but a DDT project doesn't do likewise. The HelloWorld.d prints the correct output to the console but there doesn't seem to be any debug activity. > > Here are some screenshots of the Eclipse menus: > > http://tryimg.com/4/ejnj.png Oh, I forgot this one: http://tryimg.com/4/ekxk.png | |||
February 19, 2014 Re: Setting up GDB debugger with Eclipse | ||||
|---|---|---|---|---|
| ||||
 Posted in reply to Michael Sentinella | On 17/02/2014 22:32, Michael Sentinella wrote:
> On Sunday, 16 February 2014 at 14:10:03 UTC, Michael Sentinella wrote:
>> Hi, I'm new to this group and Eclipse. I have installed Eclipse with
>> DDT and GDB and the debugger steps through a HelloWorld.cpp
>> successfully, but a DDT project doesn't do likewise. The HelloWorld.d
>> prints the correct output to the console but there doesn't seem to be
>> any debug activity.
>>
>> Here are some screenshots of the Eclipse menus:
>>
>> http://tryimg.com/4/ejnj.png
>
> Oh, I forgot this one:
>
> http://tryimg.com/4/ekxk.png
The "no symbol table load" message indicates the file does not have debug information compiled in. How did you compile the executable?
| |||
February 22, 2014 Re: Setting up GDB debugger with Eclipse | ||||
|---|---|---|---|---|
| ||||
Posted in reply to Bruno Medeiros | On Wednesday, 19 February 2014 at 14:42:26 UTC, Bruno Medeiros wrote: > On 17/02/2014 22:32, Michael Sentinella wrote: >> On Sunday, 16 February 2014 at 14:10:03 UTC, Michael Sentinella wrote: >>> Hi, I'm new to this group and Eclipse. I have installed Eclipse with >>> DDT and GDB and the debugger steps through a HelloWorld.cpp >>> successfully, but a DDT project doesn't do likewise. The HelloWorld.d >>> prints the correct output to the console but there doesn't seem to be >>> any debug activity. >>> >>> Here are some screenshots of the Eclipse menus: >>> >>> http://tryimg.com/4/ejnj.png >> >> Oh, I forgot this one: >> >> http://tryimg.com/4/ekxk.png > > The "no symbol table load" message indicates the file does not have debug information compiled in. How did you compile the executable? The "no symbol table load" message only displayed a few times. I think I compiled it using Project -> Build Project and this is how I ran the executable: http://tryimg.com/4/empty.png This is where I am at with the debugger, it says it has no line number information: http://tryimg.com/4/nolin.png | |||
March 03, 2014 Re: Setting up GDB debugger with Eclipse | ||||
|---|---|---|---|---|
| ||||
Posted in reply to Michael Sentinella | On 22/02/2014 11:27, Michael Sentinella wrote: > The "no symbol table load" message only displayed a few times. I think I > compiled it using Project -> Build Project and this is how I ran the > executable: > > http://tryimg.com/4/empty.png > > This is where I am at with the debugger, it says it has no line number > information: > > http://tryimg.com/4/nolin.png When GDB says function main has no line number information, it's referring to the C runtime main function, not the D main from HelloWorld.d . Normally none of the C runtime will have debug information. In that situation, if you place a breakpoint int the writeln("Hello world!") line, and then resume execution, it should run up to that point. Give that a try. -- Bruno Medeiros https://twitter.com/brunodomedeiros | |||
March 12, 2014 Re: Setting up GDB debugger with Eclipse | ||||
|---|---|---|---|---|
| ||||
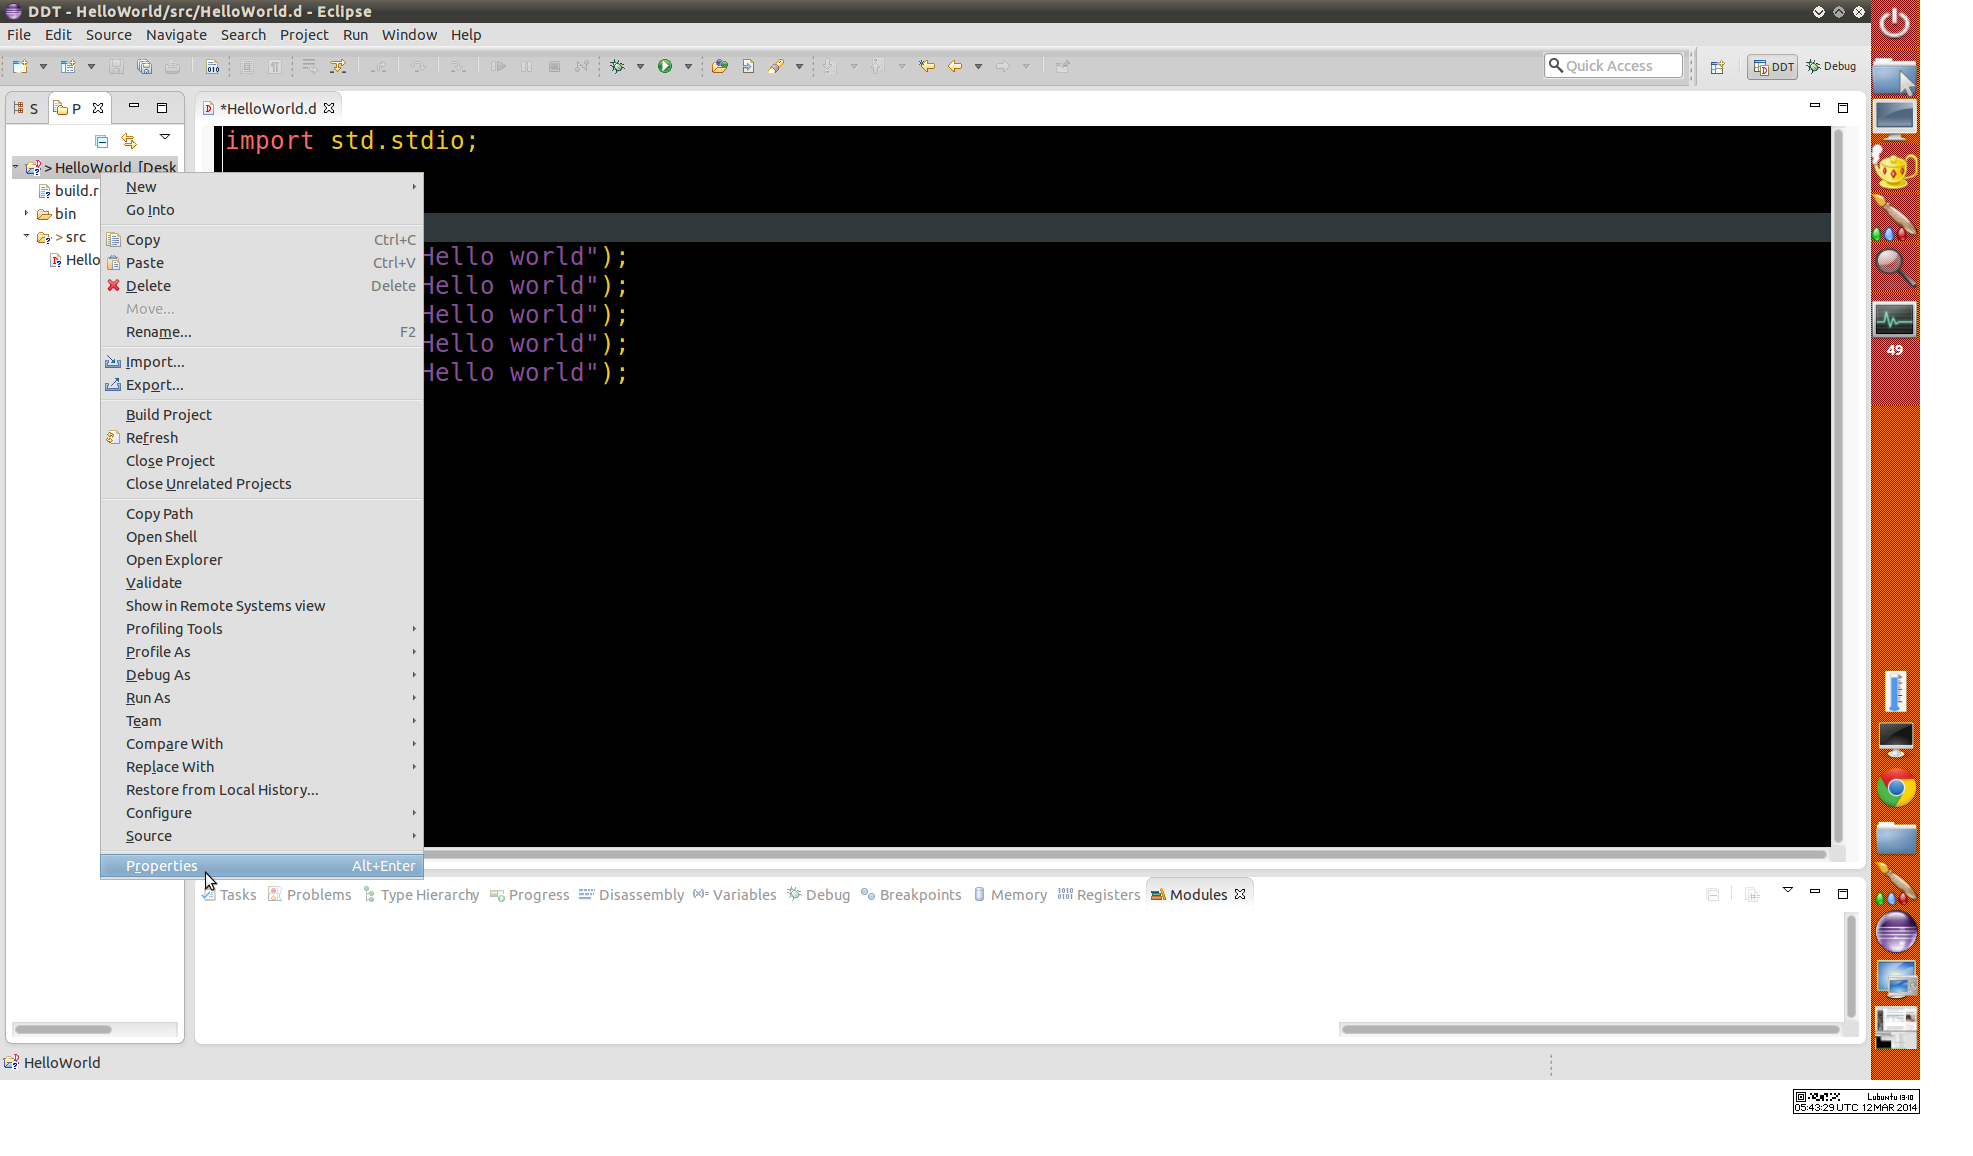
Posted in reply to Bruno Medeiros | >> This is where I am at with the debugger, it says it has no line number >> information: >> >> http://tryimg.com/4/nolin.png > > When GDB says function main has no line number information, it's referring to the C runtime main function, not the D main from HelloWorld.d . Normally none of the C runtime will have debug information. > In that situation, if you place a breakpoint int the writeln("Hello world!") line, and then resume execution, it should run up to that point. Give that a try. I have found the problem and now the debugger works as can be seen in the screen-captures below. The compiler DMD was not being given the -g argument. Right-click project http://tryimg.com/4/1righ.png Click project properties http://tryimg.com/4/2hove.png Resize window http://tryimg.com/4/4proj.png Window resized http://tryimg.com/4/8proj.png Emplace -g as argument for compiler http://tryimg.com/4/9comp.png Click debug http://tryimg.com/4/10deb.png No source available, close that. http://tryimg.com/4/11nos.png Click Step-Over, reaches breakpoint http://tryimg.com/4/12ste.png Click Step-Over again, execution steps forward http://tryimg.com/4/13ste.png Click Step-Over again, execution steps forward http://tryimg.com/4/14ste.png Cheers, Mike. | |||
March 12, 2014 Re: Setting up GDB debugger with Eclipse | ||||
|---|---|---|---|---|
| ||||
Posted in reply to Michael Sentinella | On 12/03/2014 12:16, Michael Sentinella wrote: > Emplace -g as argument for compiler > http://tryimg.com/4/9comp.png That works, although the original intention was that "-g" option should be added in its own line in the "Managed response file" field. It actually should be added by default, so maybe it didn't due to a bug. In any case it doesn't matter anymore, all that functionality has been removed in the upcoming version of DDT, replaced by the DUB builder. -- Bruno Medeiros https://twitter.com/brunodomedeiros | |||
Copyright © 1999-2021 by the D Language Foundation