
May 10, 2015 Re: Breaking changes in Visual C++ 2015 | ||||
|---|---|---|---|---|
| ||||
 Posted in reply to Walter Bright | On Saturday, 9 May 2015 at 23:36:03 UTC, Walter Bright wrote:
> On 5/9/2015 4:10 PM, Dicebot wrote:
>> On Saturday, 9 May 2015 at 22:44:28 UTC, Walter Bright wrote:
>>> Build systems cannot handle giving different compile flags to different files?
>>> Back to using 'make' :-)
>>
>> Compiling different object files with different version flags is current illegal
>> in D and may result in linking errors.
>
> That's true with many flags for C and C++ compilers, too. But it doesn't stop anyone from routinely using different flags for different source files.
>
> (dmd's makefiles, for example)
Until it breaks. And it breaks pretty fast with version(unittest) if you start using it as a common idiom.
| |||
 Permalink
 Reply
ReplyMay 10, 2015 Re: Breaking changes in Visual C++ 2015 | ||||
|---|---|---|---|---|
| ||||
 Posted in reply to Dicebot | On 5/9/2015 5:26 PM, Dicebot wrote:
> Until it breaks. And it breaks pretty fast with version(unittest) if you start
> using it as a common idiom.
It's no harder to get right than -DWHATEVER in C and C++.
Any system that has separate compilation and conditional compilation means taking a bit of care when mixing them.
| |||
May 10, 2015 Re: Breaking changes in Visual C++ 2015 | ||||
|---|---|---|---|---|
| ||||
Posted in reply to Walter Bright | On Sunday, 10 May 2015 at 01:04:31 UTC, Walter Bright wrote: > On 5/9/2015 5:26 PM, Dicebot wrote: >> Until it breaks. And it breaks pretty fast with version(unittest) if you start >> using it as a common idiom. > > It's no harder to get right than -DWHATEVER in C and C++. > > Any system that has separate compilation and conditional compilation means taking a bit of care when mixing them. https://issues.dlang.org/show_bug.cgi?id=13454 | |||
May 10, 2015 Re: Breaking changes in Visual C++ 2015 | ||||
|---|---|---|---|---|
| ||||
Posted in reply to Dicebot | On 5/9/2015 6:25 PM, Dicebot wrote:
> https://issues.dlang.org/show_bug.cgi?id=13454
Thanks for the link. Thought it best to reply there.
| |||
May 10, 2015 Re: Breaking changes in Visual C++ 2015 | ||||
|---|---|---|---|---|
| ||||
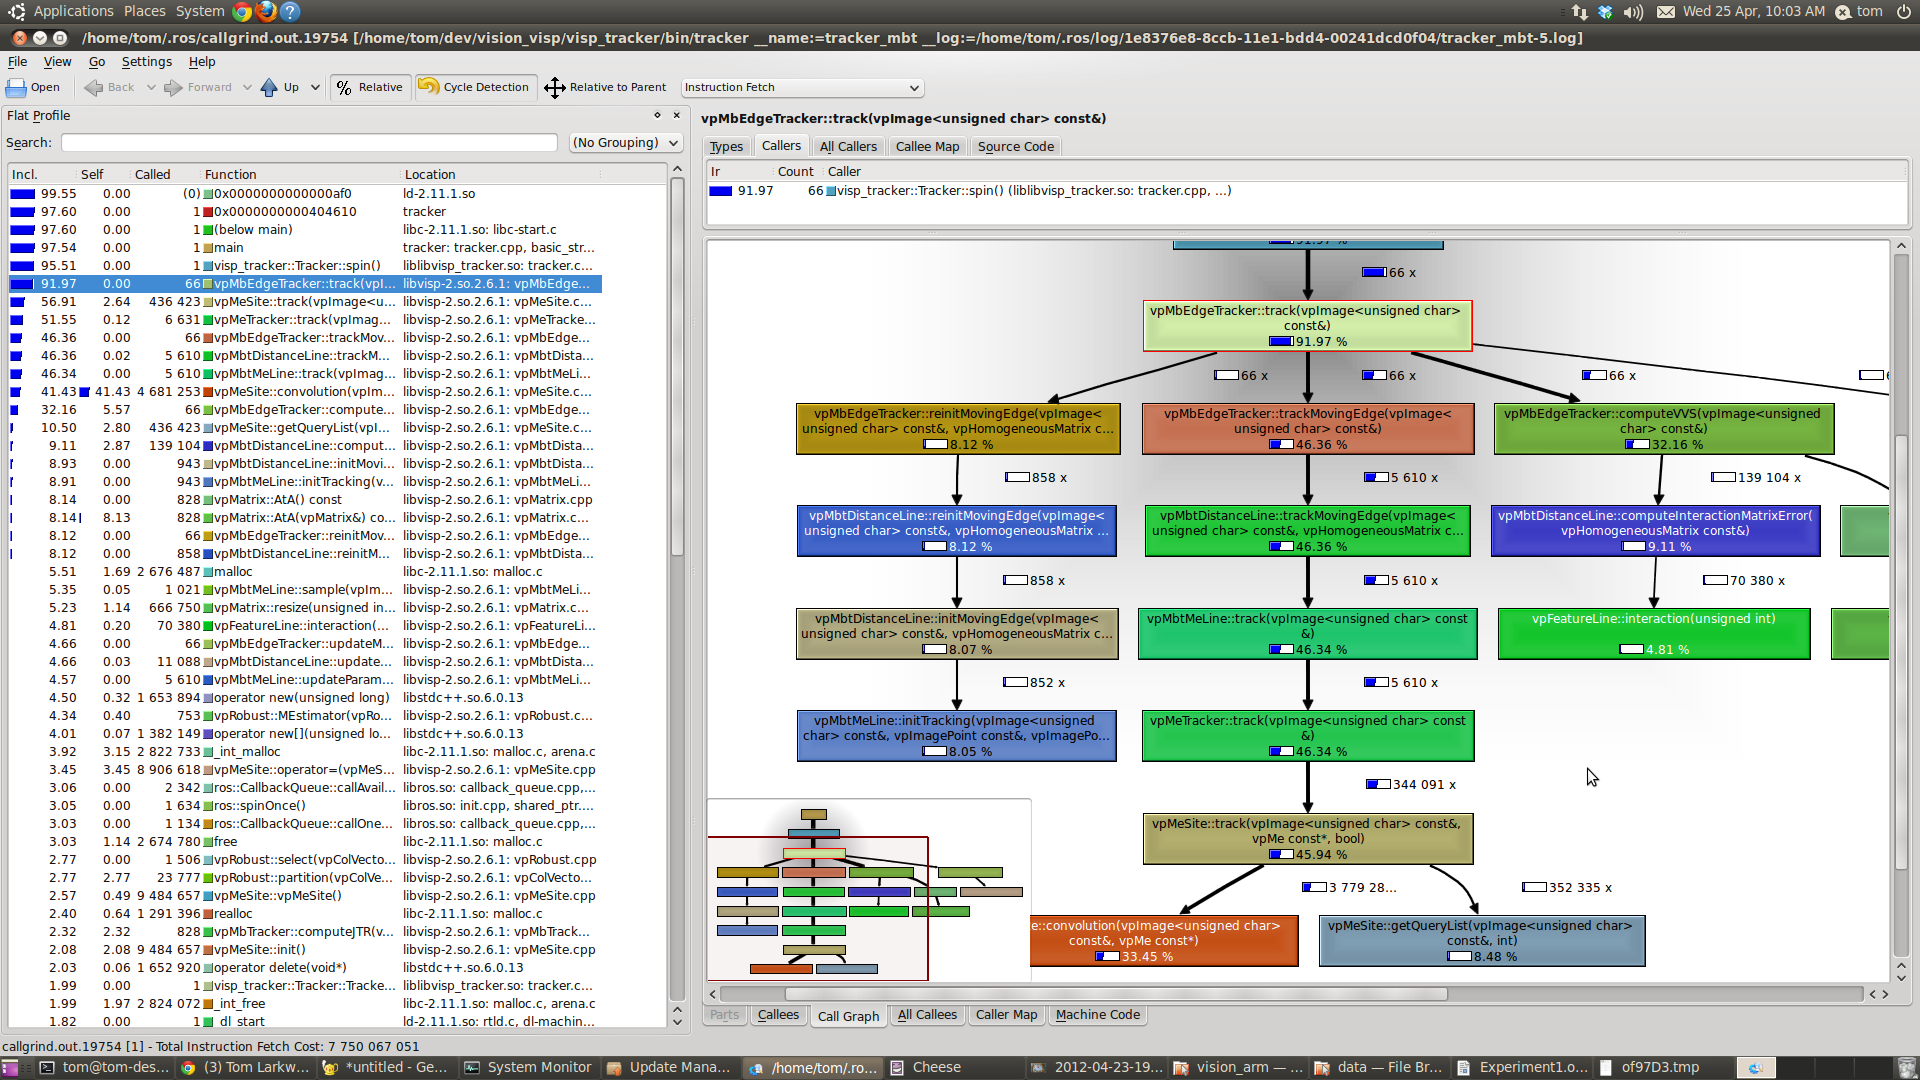
 Posted in reply to Walter Bright | On Friday, 8 May 2015 at 22:57:54 UTC, Walter Bright wrote: > It works perfectly fine and obviates the need to create a separate test harness. > As long as you are doing trivial toy programs, that is perfect. > Try using gcov without going back to consult the manuals on it. Even if you have it installed. Coverage analyzers in other languages that I checked all required finding and installing some extra package, then trying to figure out how to hook it in. > As mentioned elsewhere one want to compared itself to the guy in town, not the drunk hobbo. > >> Last but not least, things like: >> if (foo && bar) ...; >> >> Contains 2 branches. The output we have to not provide data about this, which >> makes the coverage infos lacking in some regard. > > Check before assuming -cov does it wrong. You'll find it counts the branches separately. It does sum them for the line count, but writing it as: > > if (foo && > bar) > .... > > you'll get two counts. What I am disappointed in is the repeated default assumption, without bothering to check, that D's tools are guilty until proven innocent. > My bad. It is still clowny that I have to format my code in a particular way to get that result. Not formatting my code that way, I never noticed that the result even existed in the first place. But still, that is clowny and confirms the general impression that these tools are bad. See, there are iPhone and nokia phones. They do the same thing: they load web pages, they do phone calls and sms, they runs various apps and so on. An iPhone more than twice the price of a nokia lumia. Still, people are willing to wait in line to buy the new iPhone while nokia is going bankrupt. Why is that ? Because in one case, the damn thing is thought through to the most insignificant details once the other works and that's good. You can do this if you format you code in some bizarre way is a bad excuse and nothing else. >> In java for instance, I could run tests (and not the whole program with test at >> startup) and get all the coverage infos directly in my editor with colors and >> stuff, include things like short circuit for boolean operators, which we don't >> have. We are miles (kilometers damn it !) away from this level of support. > > Here's a slice of a D coverage report: > > > |static if (allSatisfy!(hasMobileElements, R)) > |{ > | RvalueElementType moveAt(size_t index) > | { > 6| foreach (i, Range; R) > | { > | static if (isInfinite!(Range)) > | { > 0000000| return .moveAt(source[i], index); > | } > | else > | { > 3| immutable length = source[i].length; > 5| if (index < length) return .moveAt(source[i], index); > 1| index -= length; > | } > | } > 0000000| assert(false); > | } > |} > std\range\package.d is 91% covered > > It's not in color, I concede that. Saying this report is "miles behind" is ludicrous, besides the incorrect statement that short circuits are not supported. > Color are beside the point. That is a good report. That is still miles behind what you can have in java for instance. I can't have the coverage per test case, to know what test is testing what for instance (which is arguably mostly due to how tests are ran in the first place). It does give me information depending on the formatting of my code. These may not seems like important things, but that is what makes the difference. >>> 4. profiler >> Same things, this is a standard tool nowaday for any language worth considering. >> In fact, even if we had no specific support in D for it, C/C++ tooling could >> probably do it for us to some extent. > > Yah, I know about gprof. Try it (with a C or C++ program), without spending time with the manuals. Here's the manual for D: > > dmd -profile foo > > 1/ I usually use callgrind based tools rather than gcov, and then I can explore the result with something like KCacheGrind which can show me the informations in all kind of forms. http://edinburghhacklab.com/wp-content/uploads/2012/04/kcachegrind.png Not only this is more convenient to explore the data, but I get the same tool to work with PHP, C++ or whatever else. On the other hand, I have something like: $ cat trace.log ------------------ 1 main _Dmain 1 45 45 ------------------ main 0 0 0 1 _Dmain ======== Timer Is 3579545 Ticks/Sec, Times are in Microsecs ======== Num Tree Func Per Calls Time Time Call 1 12 12 12 _Dmain 1 0 0 0 main For reference, the format used is named callgrind and many tools can manipulate it: http://valgrind.org/docs/manual/cl-format.html 2/ Tested on SDC's test runner, it makes the test runner segfault. It is not even a complicated program. That is once against the nokia vs apple thing. >>> 5. and as of last week, a memory usage profiler >> Good memory allocator like tcmalloc and/or jemalloc have detailed output. > > They don't come with C or C++. Pray you can find one that works with your version of the compiler on your platform, and there are no conflicts with 3rd party libraries. No such worries with D compilers. > I can use both tcmalloc and jemalloc on WAY MORE plateforms that D supports. >> And if we go back to java, you can even observe things in a graphic way in real time >> concurrently to the application running ! Once again, we are not even remotely >> close to anything like this. > > It's designed so that you can write one without changing anything in the compiler. All you gotta do is override the default one in druntime, which merely aggregates the statistics and prints a report. That report is 90% of what anyone needs. If you want to change the report generator to produce color html output, probably 30 min work, feel free. I know it is doable. Java does it. But D does not. I'm discussing what we have right now, not what we could hypothetically have if you, me, and others had infinite time. As D does not, it can't be pointed as a strong asset of D. | |||
May 10, 2015 Re: Breaking changes in Visual C++ 2015 | ||||
|---|---|---|---|---|
| ||||
Posted in reply to Walter Bright | On Friday, 8 May 2015 at 19:59:35 UTC, Walter Bright wrote:
> On 5/8/2015 7:03 AM, Chris wrote:
>> The funny thing is that people keep complaining about the lack of tools for D,
>> and when a tool is built into the language they say "That tool shouldn't be part
>> of the language". Yet, if it were omitted, people would say "Why doesn't D have
>> this tool built in?". Human nature, I guess.
>
> I see it slightly differently. If the tool is built in to the language, people do not regard it as a tool anymore when preparing a mental checklist of "available tooling".
>
> ---- Warning! Another Boring Walter Cutaway -------------
>
> It reminds me of back when we were selling the Zortech C++ compiler, we included complete runtime library source with the compiler. This was back in the days when most compilers' library source code was a closely held trade secret.
>
> Nobody noticed that we included the runtime library source.
>
> Then, one day, Borland decided to make their previously trade secret library source code available as a separate purchase. They did an amazing job marketing this, and journalists everywhere celebrated the forward thinking breakthrough. Even in magazine compiler roundup reviews, the journalists would breathlessly note that one could now buy Borland's library source code, but Zortech C++ including it for free was never mentioned.
>
> We threw in the towel, and made the library source code a separately priced add on. This was a big success for us!
>
> No, I'm not suggesting we unbundle unit testing, Ddoc, coverage analysis, profiling, etc., into separate tools for marketing purposes. I'm just bemused by how perceptions work.
>
> ------------------------------------------------------
I love these war stories :)
| |||
May 10, 2015 Re: Breaking changes in Visual C++ 2015 | ||||
|---|---|---|---|---|
| ||||
Posted in reply to deadalnix | On 5/9/2015 8:56 PM, deadalnix wrote: > As long as you are doing trivial toy programs, that is perfect. The compiler is not a trivial toy program - it's how I made DMC++ still the fastest C++ compiler available. I also used it on dmd. dmd being very fast is not an accident. > My bad. It is still clowny that I have to format my code in a particular way to > get that result. Not formatting my code that way, I never noticed that the > result even existed in the first place. Consider: 5| foo(); 7| if (a && b) If you were examining the line counts, wouldn't you notice something like that? It's pretty obvious that a is executed 5 times and b twice. I use this tool a lot. I get what's needed out of them, while keeping the report as a simple printout. > I can't have the coverage per test case, to know what test is testing what for > instance (which is arguably mostly due to how tests are ran in the first place). > It does give me information depending on the formatting of my code. These may > not seems like important things, but that is what makes the difference. I saw the report in the picture you linked to. It looks nice. How will it make me more productive? > On the other hand, I have something like: > $ cat trace.log > ------------------ > 1 main > _Dmain 1 45 45 > ------------------ > main 0 0 0 > 1 _Dmain > > ======== Timer Is 3579545 Ticks/Sec, Times are in Microsecs ======== > > Num Tree Func Per > Calls Time Time Call > > 1 12 12 12 _Dmain > 1 0 0 0 main All that's needed to make DMC++ still the fastest C++ compiler. (The dmd profiler is the same as the DMC++ one, but fixed for multithreading.) It tracks who are the top time users, and how they get called in a simple format. I understand that those colorful graphical displays look pretty, and are fun to browse around on. What I don't understand is how that translates into a programmer being more productive with those results, let alone miles more productive. > For reference, the format used is named callgrind and many tools can manipulate > it: http://valgrind.org/docs/manual/cl-format.html Thanks for the link, I've never heard of that before. Switching to it, however, now means that the poor user has to download and install more tools to get results, and the process of using it is no longer one step. [If cl-format is really miles better, why not submit a PR to have the dmd report generator output that?] One output from -profile you might not have noticed is a .def file. This sets the link order for functions, so that functions that are strongly connected at runtime are located adjacent to each other. Makes for much better virtual paging and cache performance. It currently only works for Optlink, because nobody cares about it. > I can use both tcmalloc and jemalloc on WAY MORE plateforms that D supports. My point is you are guaranteed to have the D tools with every D compiler, regardless of what platform it is on. And of course you can use tcmalloc and jemalloc with D, if you want to. > Tested on SDC's test runner, it makes the test runner segfault. The only known cause of -profile seg faulting was running it on multithreaded programs. That's been corrected. If this is something else, without a bugzilla report, nothing will happen. And that's true with every language. | |||
May 10, 2015 Re: Breaking changes in Visual C++ 2015 | ||||
|---|---|---|---|---|
| ||||
 Posted in reply to Walter Bright | On Fri, May 08, 2015 at 10:36:28PM -0700, Walter Bright via Digitalmars-d wrote: > On 5/8/2015 10:09 PM, H. S. Teoh via Digitalmars-d wrote: > >The built-in dmd profiler is unfortunately unusable for me because its function call counters wrap around far too early (IIRC they use 16-bit counters or something like that), > > 32 bit counters > > https://github.com/D-Programming-Language/druntime/blob/master/src/rt/trace.d#L38 > > >whereas the test cases I need to > >optimize for are the long-running, steady state test cases in which > >millions or billions of function calls are made. > > > >Will this ever be improved? > > if (bugzilla report submitted || developers are mind readers) > { > maybe it'll get fixed! > } > else > { > nobody knows there's a problem > } > > Feel free to submit a PR to make 'count' a ulong. https://issues.dlang.org/show_bug.cgi?id=14565 I also just realized that on Posix the profiling code apparently relies on the rdtsc instruction, which counts CPU cycles in a 64-bit counter -- given the high frequencies of modern CPUs, moderately long-running CPU-intensive processes easily overflow this counter, leading to wrapped-around timing values and completely garbled output. gprof, for all of its flaws, does not suffer from this problem. T -- Curiosity kills the cat. Moral: don't be the cat. | |||
May 10, 2015 Re: Breaking changes in Visual C++ 2015 | ||||
|---|---|---|---|---|
| ||||
 Posted in reply to Andrei Alexandrescu | On Saturday, 9 May 2015 at 00:24:45 UTC, Andrei Alexandrescu wrote:
> The issues with unittests are legit, albeit fixable. It's goofy to run the program after unittests, and unittests should have names that can be introspected, selected etc. I couldn't find much merit with the rest of the list. -- Andrei
Those are really the only ones that I've ever thought made sense, and in several cases, the things that folks want are things that I very much _don't_ want (e.g. continuing to execute a unittest block after an assertion failure). However, while it _is_ a bit goofy that the unit tests run just prior to the program running, it's easy enough to work around that I've never considered it a big deal. Maybe the solution would be to simply make it so that main gets replaced when you compile with -unittest rather than forcing you to do something like
version(unittest) void main() {}
else void main()
{
...
}
It's the lack of unit test names that poses a potentially big problem for large projects. But even that shouldn't be hard to fix - especially when unittest blocks are already functions with names to begin with; it's just that you can't name them yourself. But at least their names have their line number in them now. That didn't used to be the case, which was even worse - though I'm willing to bet that most folks don't realize that the unittest block's line number is in its function name.
- Jonathan M Davis
| |||
May 10, 2015 Re: Breaking changes in Visual C++ 2015 | ||||
|---|---|---|---|---|
| ||||
 Posted in reply to H. S. Teoh | On 05/10/2015 07:39 AM, H. S. Teoh via Digitalmars-d wrote: > I also just realized that on Posix the profiling code apparently relies > on the rdtsc instruction, which counts CPU cycles in a 64-bit counter -- > given the high frequencies of modern CPUs, moderately long-running > CPU-intensive processes easily overflow this counter, leading to > wrapped-around timing values and completely garbled output. > > gprof, for all of its flaws, does not suffer from this problem. http://www.wolframalpha.com/input/?i=2^64%2F%289+GHz%29 What am I missing? | |||
Copyright © 1999-2021 by the D Language Foundation